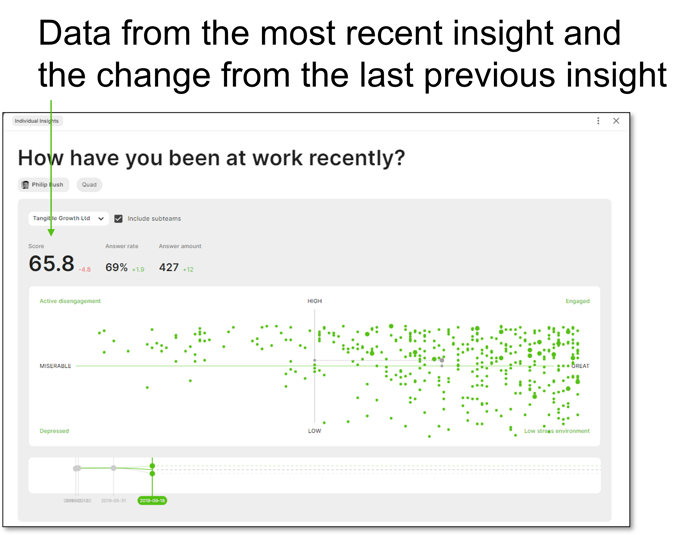
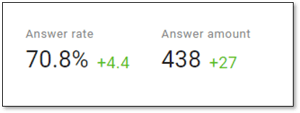
In addition to the responses people have given, TG also calculates some numerical data for each insight. As a minimum this is the answer rate and the answer amount.
If the Insight is a 'pulse' question that has been asked before then the numerical change from the last previous insight will be shown.
All the examples below show data from questions that have been asked at least twice.
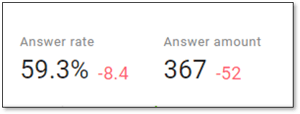
You will notice that if the numbers have increased they will be shown in green and if they have decreased they will be shown in red.
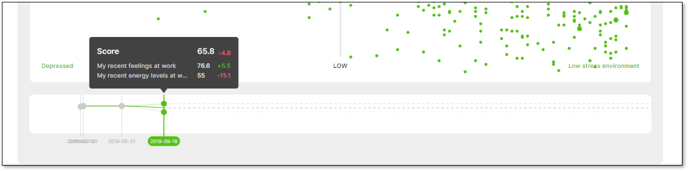
If the question has been asked two or more times then you can also see the numerical change illustrated as a tooltip on the Insight timeline - see the Quad example below.
Quad
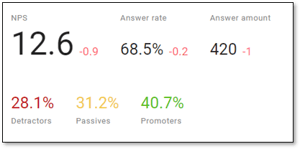
NPS
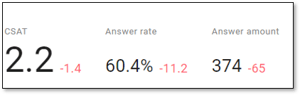
 CSat
CSat
 Multiple choice
 Open text
Note: to reinforce the importance of everyone answering and to ensure a higher response rate, always give feedback on Insight responses.
The feedback can also be shared through the Context Sharing feature of TG. This two-way flow of information forms an important part of the ongoing dialogue in organisations.
You can give specific feedback on:
- How you interpreted the responses.
- What analysis you have on the responses.
- What actions you will take based on the responses given.
- If you choose to take no action, explain why.
You may also find that the Individual Insight has created the need for a further Insight to explore in greater depth what has been brought up in the original Insight.